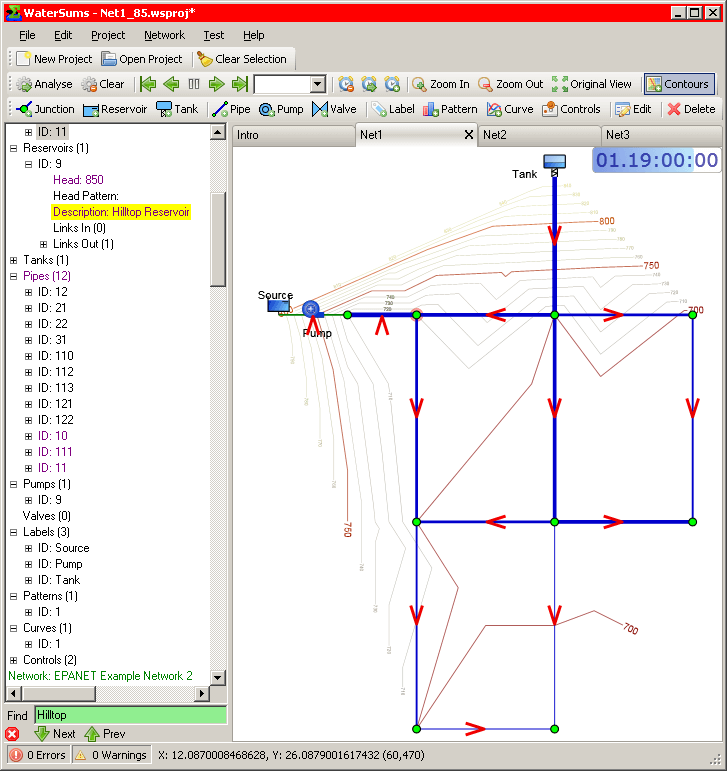
There are 3 network tabs – the project contains 3 networks loaded by drag and drop.
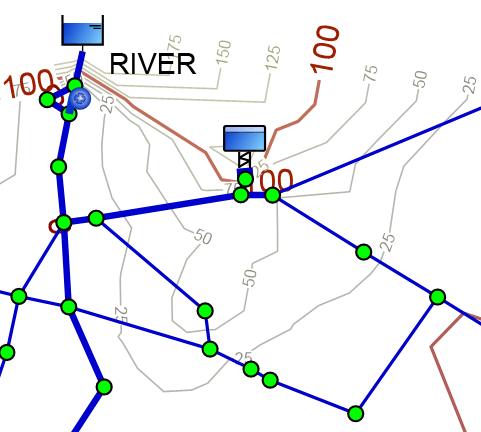
The reservoir selected in the tree is highlighted in the network map – all selections made in the map view will also be made in the map view and vice versa.
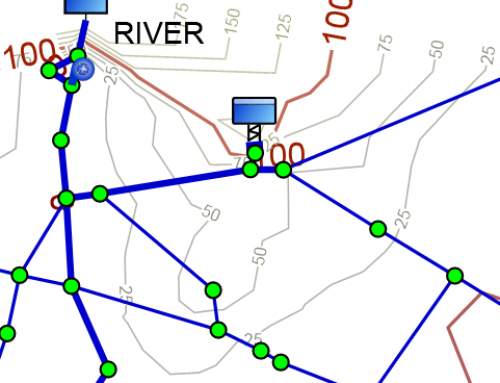
Pipe thickness and tank symbol size indicate the relative diameter of the pipes and tanks
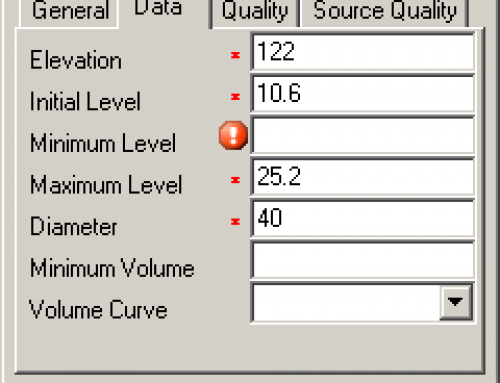
Contours are built from elevations specified for the network nodes.
Current time in the simulation is shown in the top right of the map window. The progress bar in the background indicates the relative position in the entire simulation.
The orange-red arrows indicate flow direction at the current time in the simulations as analysed by the program. These arrows move with time to reflect network conditions during the simulation. An arrow pointing across a pipe, pump or valve indicates that there is currently no flow in that item.
Tank levels vary with time to reflect the calculated level at the current time in the simulation.
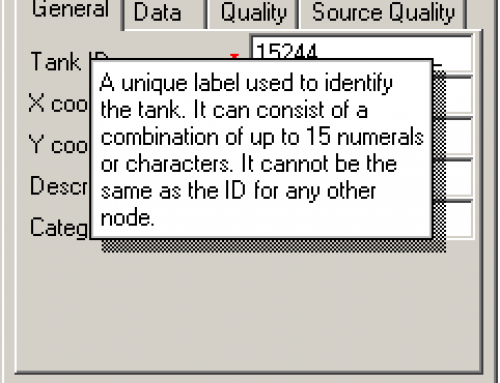
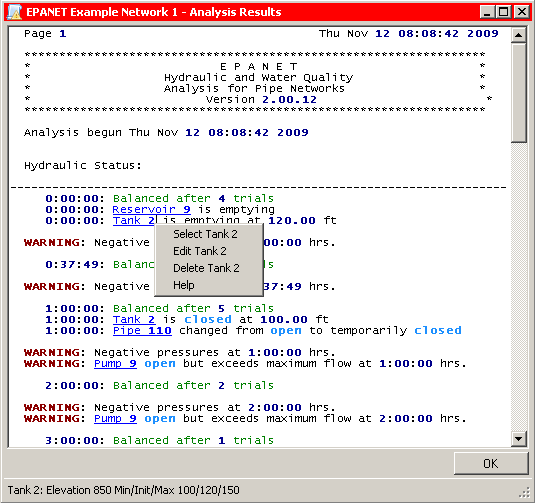
The asterisk (*) next to the project filename in the title bar indicates that the network has been changed since it was last saved.
