
Introduction
Background Maps
 WaterSums 1.2 uses Leaflet to support the display of background maps shown behind a semi-transparent network map.
OpenStreetMap colour and black and white maps are available under an open licence, so WaterSums can display these maps without any extra licence fees or complexity. WaterSums satisfies the compliance requirements by including in the background map an acknowledgement of the OpenStreetMap contributors and their valuable work. Other background map providers build on OpenStreetMap data: some (eg. MapQuest Open) have similar requirements, while others (eg. Thunderforest) may require payment depending on usage. Visit the links provided in the Background Map Configuration panel in WaterSums to see the specific requirements for a particular map supplier. This should be done before using the map tiles.
CloudMade maps are also supported, but these have different licensing and now target high use enterprises. You will require a CloudMade API key as part of an enterprise agreement which will involve extra cost.
Please note that WaterSums does not provide any bundled mapping licence or map data in the licence fee – if you wish to display background maps, you or your employer will need to satisfy the licensing requirements of the map providers.
To configure the display of background maps for an existing project, follow the simple instructions here.
Changes in WaterSums 1.2
WaterSums 1.2.5.0 7 September 2016 (Build 1.2.5.135)
New or modified features
- Windows 10 is now supported.
- A new menu option View > Zoom to Selection and a new Network Toolbar “Zoom Selection” button have been added for zooming and/or panning to the currently selected object.
- A new command
ws_zoom_to_objecthas been added. - A Terrain Shading button has been added to the Network Toolbar.
- Tooltips displayed for map objects have been offset a little further from the object so that they do not obscure the object.
- Balloon tooltips are no longer used for displaying tooltips on network maps. This was changed because balloon tooltips do not behave reliably with .NET 2 on Windows 10.
- In EPANET
.netand.inpfiles, Rule-based Controls can contain comments. WaterSums now supports such comments: they can be imported from EPANET files, entered and edited in the editor, saved to WaterSums projects and subsequently reloaded.
Bugs fixed
- File errors (eg. hydraulic file creation errors) which occurred during hydraulic analysis are now included in the count of errors displayed in the status bar.
- In some cases, trying to save a re-opened project that included one (and only one) imported file would generate an exception. This has now been fixed.
- Hydraulic analysis did not work on Windows 10 due to a change in behaviour of a Windows library function. This has now been fixed.
- If a simple control was deleted, the editor closed and subsequently opened again and another simple control added, the Project Tree was not updated correctly. This has now been fixed.
- Various bugs and restrictions in using the Control Editor have now been fixed.
- Fixed bug where the Preferences dialog would sometimes show the Terrain Shading setting incorrectly. This has now been fixed.
- If an error occurred during background analysis this would cause the background worker to stop. This has now been fixed.
- Fix bug where deleted patterns and curves were included in the number of patterns and curves written into an EPANET network file or WaterSums project file.
- Pump parameters in the Project Tree listed would include the description “Speed – curve <speed>” if a pump relative speed was set. This has now been fixed and says “Relative speed – <speed>” instead.
- Some menu items (Edit > Select All, Project > Remove Network, Project > Delete Project) which are not yet supported have been removed.
- Various documentation corrections and updates have been made.
Notes
- Horizontal scrolling of the map did not work in early versions of Windows 10, but now does.
- Map dragging by holding down the Ctrl key did not work in early versions of Windows 10 but now does.
WaterSums 1.2.4.0 11 August 2015 (Build 1.2.4.99)
New or modified features
- A new menu item Network > Export Map… has been added allowing the network map in the current tab to be exported to DXF (Document eXchange Format) or SVG (Scalable Vector Graphics) formats. The Save As… dialog is displayed and the file type can be specified. When exported to DXF format, the network map will include only the nodes and links.When exported to SVG format, nodes and links are included as well as contours, terrain shading and simple analysis flow animations (showing flow directions and tank levels). A draggable legend block allows control of the display of contours, terrain shading and analysis animations. Background images and maps are not included in exported maps in any format. A view control block allows panning and zooming and restoring the original view if you have panned or zoomed.
- Various documentation corrections and updates.
- Updating of web addresses in various acknowledgements.
- The USGS Elevation Point Query service has moved again, so WaterSums has been updated to use the new location and the new data format returned.
- MapQuest have changed their licensing of available services and so the web references to these have also been updated.
Bugs fixed
- A problem with some upgrades which caused the display of the licensing dialog on startup has been fixed.
- Some error messages for networks reported the errors as being related to projects. This has now been fixed.
- The network branch for wall coefficient correlation had a spelling error which has now been fixed.
WaterSums 1.2.3.2 12 March 2015 (Build 1.2.3.89)
Bugs fixed
- An image was missing from the Web Elevation Services dialog. This has now been fixed.
- When selecting Network > Analysis > Export Results… an error was displayed unless a projection had been specified for the network. This requirement was not necessary and has been removed: the error is no longer displayed if the network does not have a projection specified.
- In some cases, referential integrity checks when deleting links or nodes did not find references from simple and rule-based control to the nodes and/or links being deleted.
- In some situations, the Controls editor would display the Control Type pulldown without any entries.
- Fixed bug which caused the wsprojtree_debugging flag to be set at startup with the value of the wsproject_debugging environment variable instead of the wsproject_debugging flag.
- Fixed bugs in regular expressions for reading object qualifiers followed by an ID.
- Fixed bug in analysis output file viewer which meant that highlighting and linking of objects in the output viewer did not work properly in some cases.
- Removed some unncessary output printed during object deletion.
- Various documentation corrections and updates.
WaterSums
1.2.3.1 4 April 2014 (Build 1.2.3.88)
Bugs fixed
- MapQuest® map tiles were only being loaded from one server, thus missing the advantages of parallel loading. This has now been fixed.
- Fixed bug in the display of background maps which caused the attribution for the different map providers to be omitted. This has now been fixed.
- The version number of the previous release was incorrectly stated as 1.2.2 instead of 1.2.3 in two places in the Release Notes.
WaterSums
1.2.3 27 March 2014 (Build 1.2.3.87)
New or modified features
- New background map options/providers have been included:
- OpenStreetMap black and white map tiles,
- Thunderforest Landscape map tiles (including contours and terrain shading), and
- MapQuest Open map tiles.
- The default Web Elevation Service provider can now be specified in the Web Services tab of the Program Preferences panel displayed by selecting the menu item Edit > Program Preferences….
Bugs fixed
- Web Elevation Services status bar message was not reset when the panel was closed and displayed again. This has now been fixed.
- Fixed bug in Background Map Configuration panel where the reset button had no effect if the Custom provider was selected.
- Various documentation corrections and updates.
WaterSums 1.2.2 22 March 2014 (Build 1.2.2.86)
New or modified features
- WaterSums 1.2.0 introduced support for displaying background maps. One of the providers supported was CloudMade which has announced a policy change and now only supports high demand enterprise use. The interface in WaterSums has been updated to reflect these changes, but use of CloudMade maps is still supported.
- A new Net Services tab has been added to the Program Preferences panel displayed by selecting the menu item Edit > Program Preferences…. This tab displays details of third party web services made available by WaterSums including links to web sites including terms and conditions.
- The default setting for whether Terrain Shading is displayed when a network is opened is now a user-controlled stored preference. The setting is available on the Display tab of the Program Preferences panel displayed by the Edit > Program Preferences… menu item.
- New tools have been provided which access web services and thus require internet access. Since the services require world location, a projection must also be specified for network coordinates.
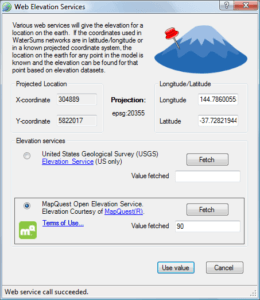
- The Data tab of panels for adding/editing of nodes (Junctions, Reservoirs and Tanks) now provide a link for obtaining elevation from web services. The web elevation services used are provided by:
- the United States Geological Survey (USGS) – for US locations only, and/or
- MapQuest® Open Elevation Service.
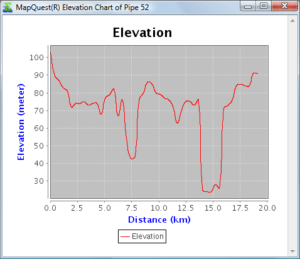 The context menu displayed when right-clicking on Pipes in the Project Tree has been enhanced by the addition of an option to display an elevation chart for the path of the pipe. Elevation charts are provided courtesy of MapQuest® and are only available if the start and end nodes for the pipe have their x- and y-coordinates provided.
- The Data tab of panels for adding/editing of nodes (Junctions, Reservoirs and Tanks) now provide a link for obtaining elevation from web services. The web elevation services used are provided by:
- Whether to display terrain shading by default or not can now be specified in program preferences.
Bugs fixed
- Fix crash when printing debug output in some special cases.
- If the Configure Background Map panel was displayed, the parameters edited and the Apply button pressed, the configuration would be applied and saved and the map updated. If, however, the parameters were subsequently edited again to return them to the original settings shown when the panel was displayed, the reverted values would not be applied or saved. The last edits would be lost when the panel was closed with the OK button. This has now been fixed.
- Various documentation corrections and updates.
WaterSums 1.2.1 25 January 2014 (Build 1.2.1.85)
New or modified features
[img_assist|nid=191|title=|desc=|link=node|align=right|width=450|height=450]
- The menu option Network > Analyse has been moved into a submenu Network > Analysis.
- Analysis results can now be exported to CSV files through a new menu option Network > Analysis > Export Results… which displays the Export Analysis Results panel. Instructions for using the panel have also been added to the Windows help file.
- Upgraded embedded Leaflet to version 0.7.2.
- Internet Explorer 6 (IE6) is no longer supported.
- Terrain Shading is no longer listed as ‘experimental’.
Bugs fixed
- In some cases the display of network maps at startup was not correct:
- when displaying background maps, moving the mouse over the map window during startup would sometimes generate an error and display a blue background (sea). Subsequent moving of the mouse in the window would also generate an error about latitude or longitude values exceeding limits.
- network objects were sometimes displayed at the wrong scale.
These problems were the result of timing issues which have now been fixed.
- The Zoom In and Zoom Out buttons on the view toolbar did not work correctly when background maps were displayed. This has now been fixed.
- When opening a project with networks which had been created in WaterSums rather than by importing EPANET files, a message about working on a local copy was displayed. This was incorrect and has now been fixed.
- The command history window was often not updated fully at startup. This has now been fixed.
- Displaying Windows Help for the Configure Background Map panel displayed an index listing instead of the specific page in the help file. This has now been fixed.
WaterSums
1.2.0.11 31 December 2013 (Build 1.2.0.81)
New or modified features
- When a project file is saved, the location and zoom level of the map view for each network is now saved and restored when the project is loaded again.
- Text can now be selected in the command history window and copied to the clipboard in RTF and plain text by selecting the text and pressing Ctrl-C.
- All example files are copied after installation of upgrades. Any existing files in the Examples directory will be overwritten. If you wish to modify the examples provided, save the edited files under another name or in a different location.
- The name of the log file is now displayed in the command history panel at startup
- The WaterSums Licence Agreement has been updated to Version 1.1 to include Software Maintenance. Read the updated licence on the WaterSums website here. If you don’t have easy internet access, read the licence.txt file in the WaterSums installation directory.
- From 1 January 2014, the price of a WaterSums licence has changed. The new prices are detailed here.
Bugs fixed
- When loading of a network map failed for any reason, WaterSums would sometimes not close down properly.
- A problem where message boxes popped up behind other programs has been fixed.
WaterSums
1.2.0.10 24 August 2013 (Build 1.2.0.80)
New or modified features
- In previous releases, only new installations copied the example networks and projects provided in the Examples directory. This has now been improved so that the examples are also copied with upgrades. Please note that any previously existing example files will be overwritten, so if you have made changes to the examples provided and wish to keep them, make sure you keep a copy elsewhere or under a different name.
Bugs fixed
- Attempting to open the demonstration project MapDemo.wsproj generated an error on computers with some date/time configurations. This has now been fixed.
- Attempting to open WaterSums projects saved on a computer with a different culture would generate an error in some situations. The problems identified have now been fixed. Saving the projects again with this release and also opening the files with this release will solve the problem.
WaterSums
1.2.0.9 23 August 2013 (Build 1.2.0.79)
New or modified features
A new View menu has been added to WaterSums which allows:- access to some of the view control options previously only available on the toolbars.
- better control of map view extents using a specified rectangular extent or the previous automatic extent calculation used in previous versions of WaterSums, Automatic extent can be enabled or disabled. See more details below.
- display of backdrop images (BMP, EWF, EXIF, GIF, JPEG, PNG, TIFF and WMF) with simple alignment options. See more details below.
- display of background maps provided by third parties. These may require independent licensing from the third party map providers. See more details below.
- display of experimental terrain shading feature using nodal elevations.
- A new context menu has replaced the existing default Silverlight context menu in the map viewer. The context menu contains with the following options:
- Zoom In – zoom in with the new map centre based on the location of the right-click.
- Zoom Out – zoom out with the new map centre based on the location of the right-click.
- Reset View – redraw the map at the default scale and location.
- Clear Selection – remove any selection of a network object which has been made.
- [img_assist|nid=177|title=|desc=|link=node|align=right|width=442|height=441]
A new example project (MapDemo.wsproj) has been added to the Examples directory. The project contains a single network with a simplified water supply model of Melbourne, Australia. Here are two possible ways to open the file:- With no project open, right-click on the Project…
node in the Project Tree. Select Open Example Project…
from the context menu. Select MapDemo.wsproj
from the Open File
panel and press Open. - Select File > Open Project…. When the Open File dialog is displayed, look in the Examples directory and select MapDemo.wsproj. Press Open.
The network in this example file is configured to use AMG zone 55 for network coordinates and the default configuration for displaying background maps using OpenStreetMaps. The project is not an accurate model, but the location of the tanks (distribution reservoirs) is reasonably accurate to show how they can interact with the background maps.
- With no project open, right-click on the Project…
- Horizontal panning of the map window is now done by holding down the left mouse button and using the mousewheel. This modification was necessitated by the change to Silverlight 5.
- To support the display of background maps from third-party suppliers, the zoom factors used have been changed. Zooming in increases zoom by a factor of two, while zooming out reduces it by 0.5.
- Selecting View > Map Units, Projection and Extents… displays the Map Units, Projection and Extents panel. This panel allows configuration of the units used and the map extents required for a network. Alternatively, a projection can be selected which allows the network to be located on the earth and also specifies the units being used.
- Usage instructions have been added to the help file for the new map view features included in WaterSums 1.2.0: setting of units, projections and extents; display of backdrop images; display of background maps.
- Context sensitive help has been provided for all new panels: the Map Units, Projection and Extents panel, the Configure Background Map panel, and the Projection Selection panel.
[img_assist|nid=171|title=|desc=|link=node|align=right|width=509|height=462]
Pressing the Projection… button on the Map Units, Projection and Extents panel displays the Projection Selection panel. This panel allows the user to specify the projection that has been or will be used for the coordinates of the network. Note that one projection must be used for all the coordinates in a network, but different projections may be used for different networks in a project.- When a projection is set for the network, the location of the cursor displayed in the status bar also includes longitude and latitude.
- Pressing the Projection… button on the Configure Background Map panel also displays the Projection Selection panel allowing selection of the projection used in your background maps, but this is rarely required.
- The Open File dialog displayed by Project > Import Network… now displays *.NET and *.INP files by default rather than just *.NET files.
- When contours are displayed on a network map, hovering over a contour will now highlight the contour line and show the elevation in a tooltip.
- In previous releases, contour label text height was 10 times the thickness of the contour line. This has now been reduced to 8.
- Editing pipe diameters did not change the thickness of the line until the network map was redrawn. This has now been improved so that sizes are updated immediately.
- Saving an existing project now makes a backup copy of the existing project file with the extension .WSPBAK.
- [img_assist|nid=170|title=|desc=|link=node|align=right|width=199|height=213]
The display of background maps can be controlled with options on the View > Background Map sub-menu. Display of background maps is only possible once a projection projection has been specified for network coordinates. The available menu options are listed below.- Select View > Background Map > Configure… to display the Configure Background Map panel. This panel allows background maps to be configured using online maps provided by OpenStreetMap and Cloudmade. To use background maps, make sure the network projection is set first. Choose or otherwise configure the background map provider. Press OK to accept the settings and redraw the map.
- View > Background Map > Show/Hide. The option to show background maps will only be enabled when you have provided the information required to show background maps. The option to hide background maps will only be enabled when they are displayed.
- A context menu has been added for the Network Settings > Background Map branch in the Project Tree which allows the Configure Background Map panel to be displayed.
- When auto-resize network extents is disabled in the Map Units, Projection and Extents panel, background maps are hidden since auto-extend is required for sizing the network map to match the available on-line map scales. The user is warned before this happens and asked to confirm the action.
- [img_assist|nid=176|title=|desc=|link=node|align=right|width=500|height=490]
Displaying a backdrop image can help with laying out the network. Control options are available from the new View > Background Image sub-menu:- To load a backdrop image in BMP, EWF, EXIF, GIF, JPEG, PNG, TIFF or WMF format, select View > Background Image > Load Image….
- To unload a backdrop image, select View > Background Image > Unload Image.
- After loading a backdrop image, select View > Background Image > Align Image…
to change the location of a backdrop image relative to the network objects. The cursor will change to a hand and you can click anywhere in the map to ‘grab’ the network and move it over the background image. Releasing the mouse button will stop the aligning process. - To show or hide a backdrop image after it has been loaded, select View > Background Image > Show/Hide backdrop image.
- The View > Show/Hide Terrain Shading menu option has been added, toggling the display of experimental terrain shading.
- A new project file format has been introduced. Old project files can be read and saved by WaterSums 1.2. but if project files are saved in the new format they cannot be read by earlier versions of WaterSums.
- Symbols and lines are no longer scaled down when there are many items in a network map.
- Network maps are no longer scaled up or down to fill the window when the WaterSums window is resized. To regenerate the map, select View > Refresh view and the network map will be sized to fill the window as much as possible although the available scales of background maps may limit this if you are displaying background maps.
- Symbols and line thicknesses are automatically scaled down in the network view as you zoom in – necessary when using a background map or backdrop images.
- The Silverlight 5 plugin is the only supported network map viewer.
- Proj.4 version 4.7 is used for coordinate transformation.
- Other simple improvements have also been made in WaterSums.
Bugs fixed
- Help has been updated to fix various broken links in references to external sites.
- The tooltip displayed for pipes included a backslash ‘\’ before the ‘Diameter’ entry which should have started on a new line. This has now been fixed.
- If a project had been created or opened and some objects edited, closing the project and subsequently closing WaterSums when there was no project open would generate an error, reporting that there was no current project. The only way to successfully close the application was to open another project. This bug has now been fixed.
- When labels are selected, the text turns red. A bug has been fixed which caused a label to lose the red colouring when it was edited.
- When a map file was specified in the OPTIONS section of an input file, WaterSums would report that the file was not found unless a full path was provided. This has now been fixed so that if no path is given, WaterSums looks for the file in the same directory as the input file is being read from.
- Fixed bug where moving the mouse after the network was displayed but before the project had finished loading generated an error.
- When refreshing a map with terrain shading enabled, the terrain shading was not displayed unless contours were also enabled.
- When zoomed in or out, any edits to labels, lines or symbols would cause them to be drawn at the wrong size until the zoom level was changed. This has now been fixed.
- Fixed a bug where generating contours for a network where all nodes had the same elevation would generate an exception.
- When an EPANET input (.inp) file was imported which did not specify the network extent, the default network extent of (0,0) to (10000,10000) was used. This has now been fixed so that the actual network extent is used and the network is set to use automatic extent sizing.
- Fixed a bug in saving a WaterSums project or writing an EPANET .net file where the count of labels written to the file included any deleted labels.
- Fixed a bug where generating contours for a network where all nodes had the same elevation would generate an exception.
- Fixed bug where if File > Save As… was selected and the Save As dialog was then cancelled, subsequent selection of File > Save As… would generate an exception.
- Fixed bug where if File > Save As… was selected and WaterSums was then closed without saving the project, an exception would occur.
- Fixed bug which caused checking/unchecking of contour menu item to be wrong at times.
- Fixed bug which caused an exception when displaying contours for a network where the network contained one and only one location with that elevation.
- Made map drawing more reliable where networks use lat/long coordinates. In some cases, extraneous black shapes would be drawn at times.
- Fixed bug where changes to a project were abandoned if they had not been saved when WaterSums was shut down and the user selected Cancel when prompted to save changes.
- Fixed bug where commands which expected arguments threw an exception when called with none instead of giving an explanatory error message.
- Various other internal fixes and performance improvements.
Known Problems
- In some cases displaying a network will not work correctly: the network map may have missing lines. This appears to happen when the coordinates used in X and Y differ by a very large amount (eg. X coordinates in the millions, Y coordinates in the hundreds or thousands). A workaround for this problem is still being sought but the problem is within the Silverlight plugin so it is difficult to discover. A workaround is to use smaller coordinate values and to have X- and Y-coordinates of a similar size (within 2 or 3 orders of magnitude).
- When displaying or refreshing the map, the cursor often becomes ‘non-busy’ some time before the view is ready.
- When creating a new project, WaterSums provides a default extent. As the number of objects in a project increases, the automatic sizing of objects will give sizes which can change quite rapidly. Refreshing the map from time to time will help to make this more consistent.
- When displaying or refreshing the map, the cursor often becomes ‘non-busy’ some time before the view is completely ready.
- When new rows are added to the curve editor they are sorted immediately, but the focus does not move to the new row which can be confusing when editing the second column after adding a new row.
- When an operation is undone, the edited entity is still displayed in the tree with the ‘modified’ colour.
- In some cases, short-cut keys do not work if the map is the current control.
- Undoing (and subsequently Redoing) the Project > New Network option does not work.
- The Anchor and Meter options for Map Label are currently saved with the network but are ignored in the map display and network analysis.
- WaterSums displays an internal error if a new project is created and the File > Revert option is selected before the project is saved for the first time.
- When right-clicking on a network heading, the Delete and Export Network context menu options do not work.
- WaterSums is known to be very slow to load large projects. Improvements have been made in this release, but performance is being worked on.
- Valves are not yet shown closed/open during simulation.
- In the Silverlight plugin, using the mouse wheel for zooming requires you to click in the map area first.
Network map display with background street maps
Background Map Configuration
[img_assist|nid=184|title=|desc=|link=node|align=right|width=128|height=128]
A map projection is a transformation of the latitude and longitude of a point on a sphere (such as the earth) into locations on a flat plane (such as a map, engineering drawing or a WaterSums network map).
To display background maps or use other WaterSums projection transformation facilities, the network coordinates must be given in a known projection. For example, in Australia, you might use AMG zone coordinates or in America, some state plane projection (eg. California Zone 2) or a UTM zone. This means the network locations need to reflect correct geographical locations. You may need to adjust some locations a little to model equipment which is crowded together in buildings, but overall layout must match the actual location of equipment.
Many different projections are provided with the Proj.4 distribution included with WaterSums – any of these projections can be used for network coordinates, including geodetic projections using latitude and longitude. Latitude/longitude coordinates (in decimal degrees) may be easier to use if locations have been found from a GPS unit.
You may find it easier to follow these steps if they are displayed in a separate window. Click here to open these instructions in a separate WaterSums HTML window (make the network you wish to configure the current tab and network-specific ‘show me’ links will work properly) or a new browser window.
[img_assist|nid=185|title=|desc=|link=node|align=right|width=128|height=128]
To display background maps, follow these steps in WaterSums.
- Specify the projection used for the network coordinates. Select View > Units, Projection and Extents… (show me). Press the Projection… button and select the correct projection in the panel displayed. Make sure you know the Proj.4 configuration file which contains the projection definition and the Spatial Reference ID (SRID) you need.
- After specifying the projection, close the Units, Projection and Extents panel by pressing the OK button.
- If you are creating a new network, you may find it easier to create some placeholders – place junctions in the corners of the extents you plan to use. This makes it easier to move around your network area background maps are displayed with automatic sizing of extents.
- Specify the background maps to be used. Select View > Background Map > Configure… (show me). Choose the map provider you wish to use. For testing or troubleshooting, Open Street Maps is the easiest to use and is the default.
- After selecting the background map provider, close the Configure Background Map panel by pressing the OK button.
- If you have provided all the information required to display background maps, WaterSums will test the projection combination given with the map extents specified (or the actual data extents if no extent has been specified). If the transformation library cannot transform the extents at all from the specified network projection to the background map projection, WaterSums will display an error and the background map configuration will not be able to be saved. You will need to correct the projection specified or change the recorded coordinates to be within the area on the earth’s surface within which the projection can be used.Please note that the fact that a projection transformation works without major errors (such as generating coordinates with values of positive or negative infinity) is not proof that your data and the projections you have specified are correct. This is only known when you can match the network layout to the background maps. Many errors are possible which will not cause complete failure of the transformation.
- If you have provided all the information required to display background maps and your extents will can be transformed into the background map projection, you will be asked whether you wish to display them or not. Press Yes if you wish to do so. The map view will be regenerated with background maps included.
If no background maps are displayed or if you see an area you do not expect, see Troubleshooting Background Maps immediately below.
Troubleshooting Background Maps
If you are having difficulties displaying background maps, first make sure you have followed the instructions in Background Map Configuration.
Some possible difficulties are discussed below:
- After configuring a network projection and background map settings, WaterSums displays an error about a failure to transform the network extent and the background map configuration cannot be be saved.WaterSums tries to transform the the map extents specified (or the actual data extents if no extent has been specified) using the projection combination given. If the transformation library cannot transform the extents at all, or if coordinates include negative or positive infinity, WaterSums will display an error as described.
- You may not have entered any data, but have a data extent specified (for example, the default extent is (0,0) to (10000, 10000)) which is not valid for the network projection you have specified. The default extent will not be valid for most projections. For simplest results, enter two placeholder points (junctions) at the bottom left and top right of the rectangle you wish to work within and then try again to configure background maps.
- You may have selected the wrong projection for network coordinates. If so, select the correct projection.
- You may have entered invalid coordinates for one or more object. If so, correct the data.
- The network map is displayed, and there is a grey background added with an acknowledgement of Leaflet, but without any map displayed:
- You may not have entered all the information required by the map provider. For example, if you are wanting to use CloudMade maps, you may not have provided an API key or the key you entered may be incorrect.
- The URL given for the background maps may be incorrect. You will not normally need to modify the URLs used by default in WaterSums it may be necessary to use the Restore Defaults button on the Configure Background Map panel.
If you still cannot resolve the problem, contact WaterSums technical support.
- The network map is displayed, but there is just a blue background displayed instead of a street map:
- The blue background is probably the sea.
- See the hints below for fixing the problem when the map is not showing the location you expect.
- The network map is displayed, but the network map shown is not the place where you expect it to be:
- Your selection of network projection probably does not match the network coordinates you have used. When the coordinates are transformed latitude/longitude and then into the coordinates used by the background maps, your network is in the middle of the sea. Review the coordinates you have used and make sure they are in the same projection as you have selected for the network projection.
- If you have modified the projection for the background maps, you may have selected an incorrect projection. Restore the default projection using the Restore Defaults button on the Configure Background Map panel to make sure that the default values provided with WaterSums are used.
If you still cannot resolve the problem, contact WaterSums technical support.
- The network map is displayed, and there is a grey background added but without any map or map provider acknowledgement displayed:
- There is a significant error in the configuration of the map provider which has caused map loading to fail completely.
- Review your background map settings carefully. It is recommended that you use the Restore Defaults button on the Configure Background Map panel to make sure that the default values provided with WaterSums are used.
- If this does not work, and you were using a map provider other than OpenStreetMaps, try using OpenStreetMaps maps instead to see if there is any difference in behaviour.
- If all attempts to display background maps also fail in this way, contact WaterSums technical support.
Quick Demo
Why not try the following simple demonstration?
You may find it easier to follow the steps of this demonstration if they are displayed in a separate window. Click here to open these instructions in a separate WaterSums HTML window or a new browser window.
Creating a project
- Open WaterSums.
- Open an explorer window in the WaterSums Examples directory which is found in My Documents\WaterSums (show me). You may also find it easier to follow these instructions if you undock the Project tree using the menu option Project > UnDock Project Tree (show me).
- Left-click and drag the file Net1.net before dropping it on the WaterSums Project tree in the left pane.
- Note that the network is imported and added to a new project with a new tab in the main window showing a map of the network.
- Drag Net2.net and drop it on the Project tree.
- Select Add to Current Project from the popup menu.
- Contour lines are generated for the network to help with the visualisation of the network in 3 dimensions. These can be turned on or off using the Contour toggle button on the Network Toolbar.
- Hovering over a contour line will highlight the contour line and show the elevation in a tooltip.
- Terrain shading can be generated for the network to help with the visualisation of the network in 3 dimensions. Turn it on by selecting View > Show Terrain Shading (experimental).
- Drag Net3.inp (not Net3.net) and drop it on the Project tree to show the seamless importing of EPANET inp files.
- Select Add to Current Project from the popup menu displayed.
- Explore the Project tree, noting that the map tabs show the network owning the branches you select and that the objects you select are also highlighted in the map.
- Move the cursor over the map area and you can observe the X, Y coordinates shown in the status bar at the bottom of the main window.
Editing
- Go to the top of the tree and right-click on the Project branch, selecting the Rename Project option from the popup menu.
- Edit the project name to “My first WaterSums project” and press Enter to commit the changes.
- Expand the Reservoirs branch in the first project and expand reservoir with ID 9. Select the reservoir branch (or one of the sub-branches) and the reservoir is also highlighted in the map view.
- Double-click on the Head branch and edit the head to 850.
- Press Enter or click outside the edit box to commit your changes; press Escape to discard them.
- Note that the text turns purple to indicate that the branch has been edited.
- Expand the branch for Junctions and expand the junction with ID 10.
- Double-click on the Demand Pattern branch and select Curve 1 from the pulldown of available curves.
- Expand the Curves branch and right-click on the Curve with ID 1.
- Select Edit Curve from the context menu.
- Try adding two new rows: (3000,190) and (5000, 67).
- Select the junction with ID 11 in the project tree and press the Delete key. Since deleting this node will affect several other network objects, a confirmation panel is displayed. This panel lists all the attached pipes that will need to be deleted when this junction is deleted. Press OK and the node and its 3 attached pipes are deleted in the project tree and map.
- WaterSums automatically analyses the modified network and the Analysis Result Summary area shows that now 219 warnings are generated because of the isolated Reservoir, Pump and Junction. Clicking in the area will display the EPANET Report file listing all of the warnings. Hyperlinks allow you to select the network objects referred to in the warnings.
- Note that if any objects needed to be modified due to the deletion, these objects also would be listed in the lower part of the confirmation panel. So, for example, if a curve were deleted, any network objects that used it would need be modified to remove their dependence on the deleted curve. Try it with the Curve ID 1 that we edited earlier and Pump ID 9 will be included in the list of objects to be modified; press Cancel to quit the operation.
- Select Edit > Undo to undo the deletion of the node and the node and its attached pipes will reappear.
More editing
- Switch to the Net2 map tab by clicking on it.
- Hover over Tank 26 – the only tank in the network – and a tooltip is displayed telling you the elevation and operational levels for the tank.
- Double-click on the tank and a tabbed panel will be displayed for editing the tank. Any of the attributes of the tank can be edited, including the location. Try setting the location to (24,75). Clicking on the map while the panel is displayed will also change the location of the tank and close the panel. Any connected pipes move with the tank. Any changes made are reflected in the project tree. Press OK to apply the changes you make.
- Press the Add Curve toolbar button on the Network Object toolbar to add a volume curve for use with the tank. Make sure the Curve Type pulldown is set for VOLUME. Set the Description field to “Tank 26 Volume Curve“.
- Imagine we are modelling a tank which from the height of 50 to the top is half of a sphere of diameter 25 rather than being cylindrical. The volume is a curve with the following points:
| Height in tank |
Tank Volume |
| 50 | 98175 |
| 55 | 107860 |
| 60 | 116675 |
| 65 | 124095 |
| 70 | 129065 |
- Enter these points into the curve editor, double-click in the graph area to rescale the graph appropriately and press the Add button to create the new curve if the curve looks right.
- Double click on the tank to display the edit dialog and select the Data tab. In the Volume Curve pulldown, select the curve you have just created. Press OK to commit the change and close the dialog.
- To add a reservoir to the network, click on the picture of a reservoir in the network toolbar. Alternatively, you can choose the menu option Network > Add Reservoir or even right-click on the Reservoirs heading in the project tree and select Add Reservoir from the context menu. WaterSums often provides several different ways of achieving the desired result so that you can work in the way that suits you best.
- The ID field is automatically set to the next available numeric value for nodal objects (Junctions, Reservoirs and Tanks). The ID can include numbers and letters and the underline characters show the available length of ID that can be used (up to 31 characters).
- Set the X, Y coordinates to (60,80).
- Set the Description field to “Midlands Reservoir“.
- Set the Total Head to 320 and press the Add button. The new reservoir is added to the Project tree and the map and selected in both.
- Click on the picture of a pipe in the Network Object toolbar to display the panel for adding a pipe to connect the reservoir to the nearest junction using the network toolbar button or the option in the Network menu. Note that the start node is already populated with the Reservoir you just created.
- Press the Tab key twice to move to the End Node field. Click in the map to select the closest node and the ID of the selected node will be displayed in the pulldown field.
- Move to the other fields to enter the mandatory values:
Length 1234,
Diameter 12,
Roughness 100.
Press the Add button to create the new Pipe. - Select Edit > Find and the Find field is displayed at the bottom of the Project tree – activated for you to type your search text into. Type Midlands in the text field and you will see the Reservoir you created highlighted in the tree. Note that this search is case insensitive, so typing ‘midlands’ would work just the same. Pressing Enter will select the Reservoir.
Analysis and other miscellaneous operations
- Select menu option Network > Analyse. This option is also available from the Network tool bar, by pressing F2 or by right-clicking on the Network heading branch and selecting Analyse Network from the popup menu.
- Once the analysis is complete, the calculated direction of flow in pipe, pumps and valves for each time step is shown with animated arrows. Changes in flow direction are shown by movement of the arrows. An arrow pointing across a network object indicates that there is no flow in the pipe, pump or valve at the current timestep. Tank levels are also shown for each time step. We’re still working on displaying more information about the analysis, but this gives a feel for the direction in which WaterSums is moving! If the analysis generates an error or warning for any reason, the error or warning is displayed and the EPANET Report File is also displayed with hyperlinks to the network objects referred to.
- Zoom in to the centre of the map by pressing the Zoom In button on the Network Toolbar. To zoom in on a particular area, point to the area, click in the map, press the Ctrl button and move the mouse scrollwheel up. Note that the simulation arrows stay the same size as does the rest of the network because it is rescaled when you zoom in or out. For other view control hints, see Map View Control Hints.
- You can save the project if you want using File > Save – any changes made will be saved in your WaterSums project file, not in the network files you imported.
- If you like to watch how a program ‘thinks’, try selecting Edit > Program Preferences (show me) and selecting the Show Command panel option.
- When you quit, you will be prompted to upload the log file to the WaterSums web site. Please press OK to allow the upload, as this helps a lot with seeing how people have used the program and if any unexpected errors have occurred. If you are not willing to do this, press Cancel. To avoid being prompted again, check the Don’t ask again… option first.
In a short demo like this, it is not possible to cover many of the features of WaterSums. Other simple features which could be covered in a longer demo include:
- Background maps and backdrop images,
- Details of pre-selection and field specific type selection in Network object Add and Edit panels,
- Pattern Editor,
- Editing of Simple and Rule-based Controls in the Control Editor,
- Page Setup, Print Preview and Print,
- Command line,
- Recent project files opened listed in the File menu
- Analysis result animation control, and
- many others.
Map View Control
The map view can be controlled with the toolbar buttons, with keyboard and mouse combinations, or with a right-click context menu.
With the Silverlight plugin, the following keyboard and mouse combinations can be used once the map is the active control:
- Move the mousewheel to pan vertically.
- Hold down the left mouse button and move the mousewheel to pan horizontally. Note that this is a change from versions of WaterSums before version 1.2.
- Hold down the Ctrl key. Clicking and holding the left mouse button allows the map to panned by dragging. Releasing the mouse button stops the dragging.
- Hold down the Ctrl key and move the mousewheel to zoom in or out. The mouse pointer stays over the same point on the map as the scale changes.
WaterSums Screenshots
[img_assist|nid=128|title=|desc=|link=node|align=right|width=727|height=771]
Below are some screenshots of WaterSums with the example networks provided.
- One of the examples is a project containing the three EPANET2 examples included with EPANET2.
- The other example project contains a network which shows the use of OpenStreetMap background maps in WaterSums.
NET1.NET: Points of note
- There are 3 network tabs – the project contains 3 networks loaded by drag and drop.
- The reservoir selected in the tree is highlighted in the network map – all selections made in the map view will also be made in the map view and vice versa.
- Pipe thickness and tank symbol size indicate the relative diameter of the pipes and tanks
- Contours are built from elevations specified for the network nodes.
- Current time in the simulation is shown in the top right of the map window. The progress bar in the background indicates the relative position in the entire simulation.
- The orange-red arrows indicate flow direction at the current time in the simulations as analysed by the program. These arrows move with time to reflect network conditions during the simulation. An arrow pointing across a pipe, pump or valve indicates that there is currently no flow in that item.
- Tank levels vary with time to reflect the calculated level at the current time in the simulation.
- The asterisk (*) next to the project filename in the title bar indicates that the network has been changed since it was last saved.
MapDemo.wsproj: Points of note
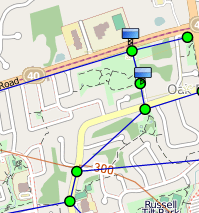
- OpenStreetMap background map of Melbourne, Australia.
- The network map configuration is shown in the project tree including the projection information (file: epsg, SRID: 20355).
- Background map configuration information is shown in the project tree: background maps will be displayed using OpenStreetMaps.
- Pipe thickness and tank symbol size indicate the relative diameter of the pipes and tanks
- Contours are built from elevations specified for the network nodes.
[img_assist|nid=181|title=|desc=|link=node|align=right|width=1332|height=881]
[img_assist|nid=186|title=|desc=|link=node|align=left|width=407|height=459]
[img_assist|nid=187|title=|desc=|link=node|align=left|width=407|height=459]
[img_assist|nid=188|title=|desc=|link=node|align=left|width=407|height=459]