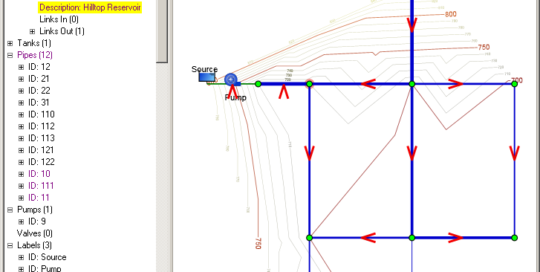
There are 3 network tabs - the project contains 3 networks loaded by drag and drop. The reservoir selected in the tree is highlighted in the network map - all selections made in the map view will also be made in the map view and vice versa. Pipe thickness and tank symbol size indicate the [...]
Automatically generated map contours
admin2017-03-25T23:23:06+11:00Map contours are generated from the elevations of the network nodes. The Contours button on the Network Toolbar toggles the display of contours.
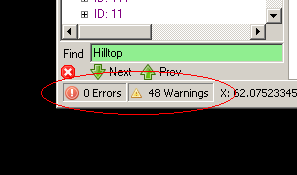
Network Analysis Summary area of status bar
admin2017-03-25T23:23:06+11:00Automatic background analysis is enabled by default. Whenever a network is modified, auto-analysis is triggered and a summary or the results (number of errors/warnings) is displayed in the analysis result summary area at the left hand end of the status bar at the bottom of the main window. After analysis has been performed once in [...]
Analysis Report Viewer
admin2017-03-25T23:23:06+11:00Network analysis result output files are now displayed in a customised file viewer panel which highlights errors and warnings. References to network objects are displayed with hyperlinks. Clicking on the hyperlink selects the object referred to in the Project tree and map window. Double-clicking selects the object and displays the object property editor to allow [...]
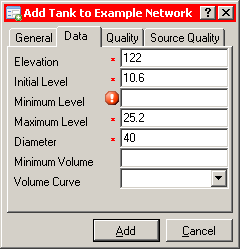
Dialog for adding a new Tank
admin2017-03-25T23:23:06+11:00Tabbed panel for entering data when creating new Tank or editing an existing Tank Mandatory fields are marked with a red asterisk (*) to the left of the field Invalid or missing values are marked with an exclamation icon Some fields have simple text entry while others use pulldowns or radio buttons
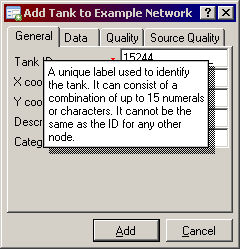
Popup help in Property Editor
admin2017-03-25T23:23:06+11:00Clicking on the question mark icon '?' turns the cursor into a question mark and popup help is then given when the user clicks on a control. More detailed help is generally available by pressing function key F1.
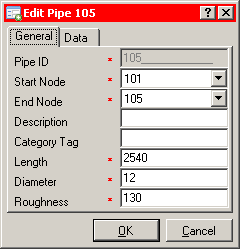
Pipe Property Editor
admin2017-03-25T23:23:06+11:00Tabbed panel for entering/editing data when editing an existing Pipe Mandatory fields are marked with a red asterisk (*) to the left of the field Invalid or missing values will be marked with an exclamation icon Some fields have simple text entry while others use pulldowns or radio buttons
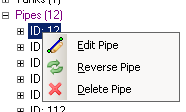
Typical context menu on right-click in Project Tree
admin2017-03-25T23:23:06+11:00Menus displayed when right-clicking on branches of the Project Tree are context sensitive and include entries appropriate for the branch being clicked on.
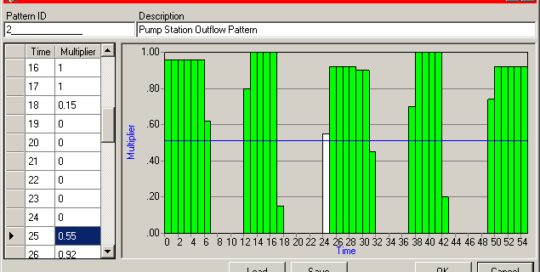
Pattern Editor
admin2017-03-25T23:23:06+11:00Patterns can be used when values vary discretely with time. Patterns specify multipliers of a given value as it varies through the time steps of a simulation.
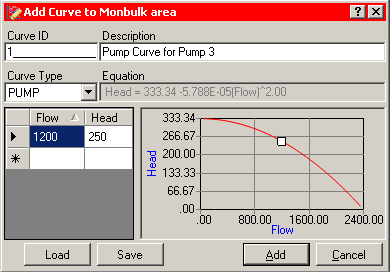
Curve Editor
admin2017-03-25T23:23:06+11:00Curves describe a relationship between two variables. Two or more network objects can share the same curve. A curve will be one of the following types: Pump curve Efficiency curve Volume curve Headloss curve

